How high will the Fed go Originally published: 2022-11-10 Updated: 2022-12-01

Update (2022-12-01)


Here's the current chart of the 10-year Treasury this morning. With the yield at 3.582% or so as I type this, the dashed line target has been hit. Mission accomplished.
Wolfe waves work incredibly well.

As I'm looking at this chart and thinking about the macro picture a bit, it sure looks like the next move for the 10-year will be to the 200-day simple moving average, which is currently at 3.067% and rising (the pink arrow). The chart pattern now looks like a head and shoulders with the target right around 3% or so, which fits. Anyway, this scenario wouldn't surprise me a bit as growth in certain sectors of the economy is slowing fast. I'm no longer convinced a recession is imminent, but a slowdown is already here. Part of what has been concerning me about growth was the super fast reduction of the fiscal deficit. This is no longer happening, so as long as inflation continues to come down (it will), and the Fed reacts by slowing rate increases and eventually pausing (it will), and the fiscal support continues (???), I think we could be entering a Goldilocks zone where stocks outperform. Looks like my year-end rally is underway.


Update (2022-11-10)

I'm not sure why, but the CPI numbers surprised a LOT of people this morning as evidenced by this MONSTER rally we're getting in equities and treasurys today. If you've been paying any attention at all, you would have known that many of the individual inflation components have been coming down hard in recent months. Yet, even with that information, people have been buying protective puts at rates approximating those of March 2020 and even March 2008. More than a little crazy.


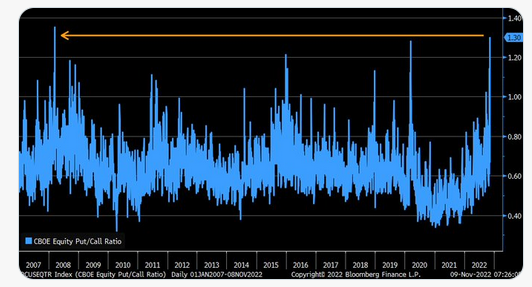
Anyway, opportunity is born out of these kinds of extremes, and I thought it was important to update this chart below.


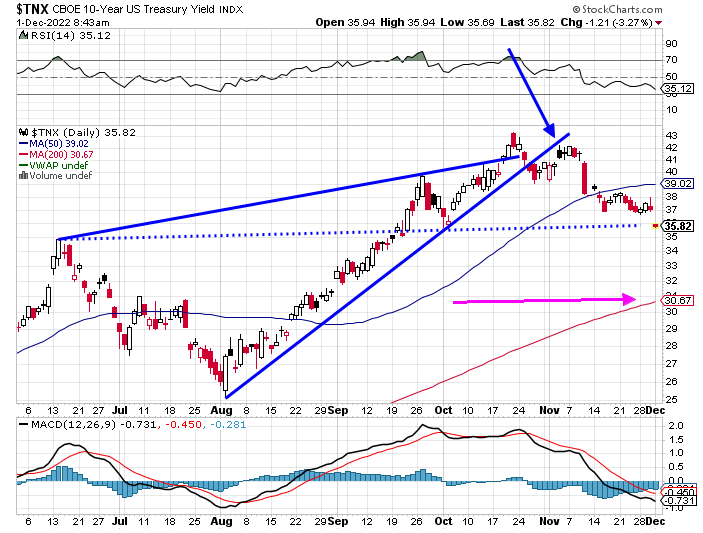
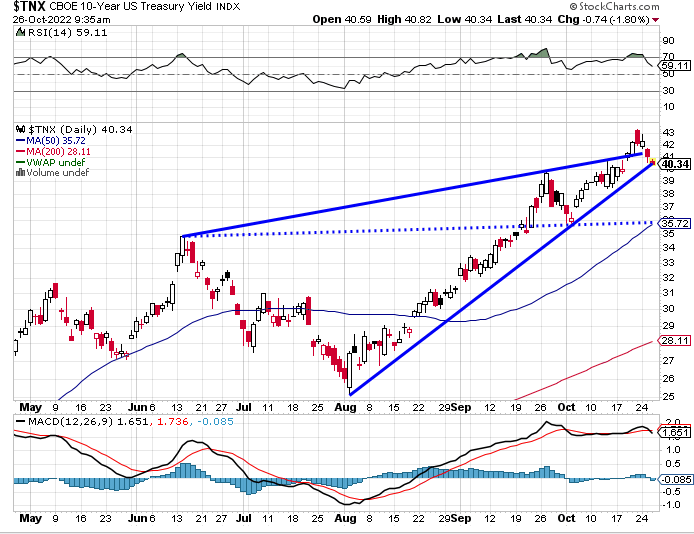
This was a classic Wolfe wave that I referenced below on October 26. It is very common for an initial break below the lower trend line to retest the under side of it as it did at the arrow. But the news today on inflation caused the massive flight into the 10-year, bringing down yields in a big way. I still expect the yield to hit that 3.6% area in the short term, but we'll see.

The Fed

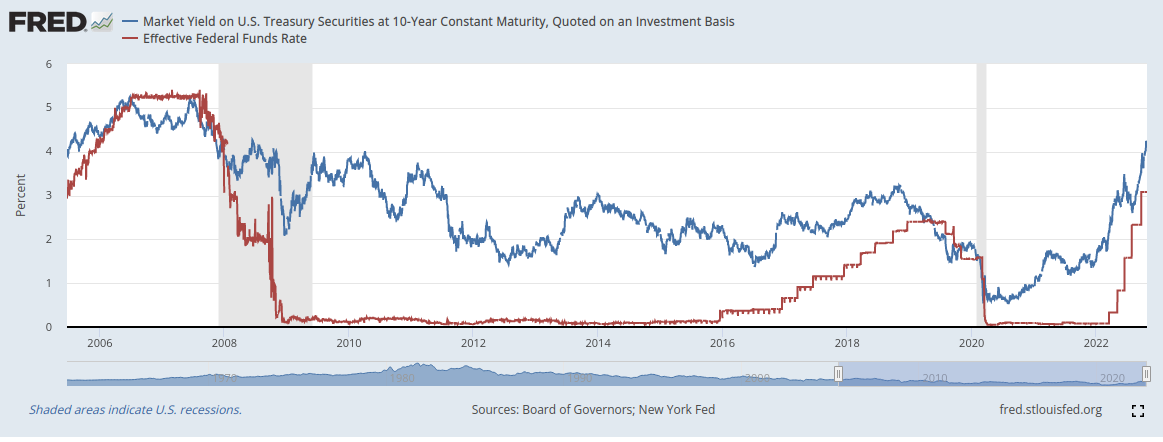
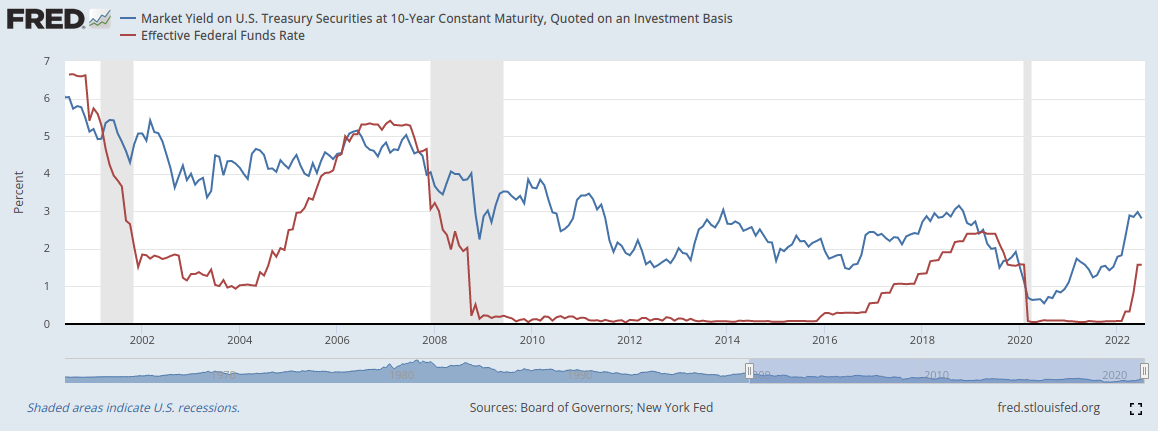
I love Warren Mosler's characterization of the Federal Reserve as like the kid with a toy steering wheel in the back seat pretending to drive the car. The inflation we've had this year has mostly been supply side, which is nearly impossible for the Fed to control. Their hiking campaign has been pretty regressive as it affects the poor disproportionately. Anyway, there is now evidence that the hiking cycle is nearing an end as the 10-year yield is about even with the effective Fed funds rate. Once the 10-year yield goes below the Fed tends to at least pause.

Here's that updated chart:


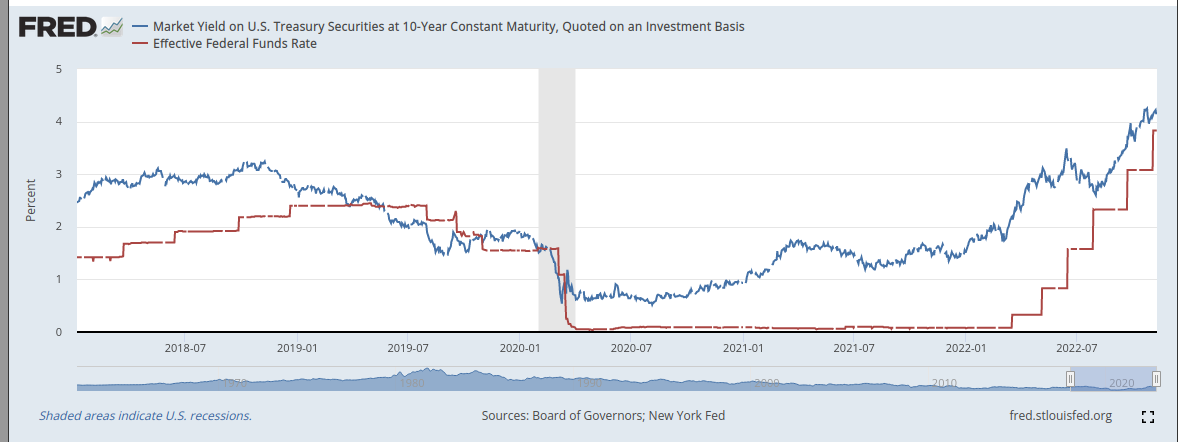
The 10-year yield for today is not shown on that chart yet. It is at 3.85% as I write this, which is almost even with the effective Fed Funds rate as of yesterday. The Fed may "declare victory" over the coming weeks and months. They've been having a lot of fun with that toy steering wheel!

I'm still looking for a year-end rally in stocks, and it may have already begun.


Update (2022-10-26)

The Fed meets again next week to continue their unprecedented campaign of rate hikes. The consensus is for another 75 basis point increase.


Given that the current target rate is 300-325, they'll more than likely increase rates to 375-400, which is 3.75% - 4.00%.

The chart below from FRED is an updated version of the one farther down in the article. It plots the 10-year Treasury yield and the effective Fed funds rate.


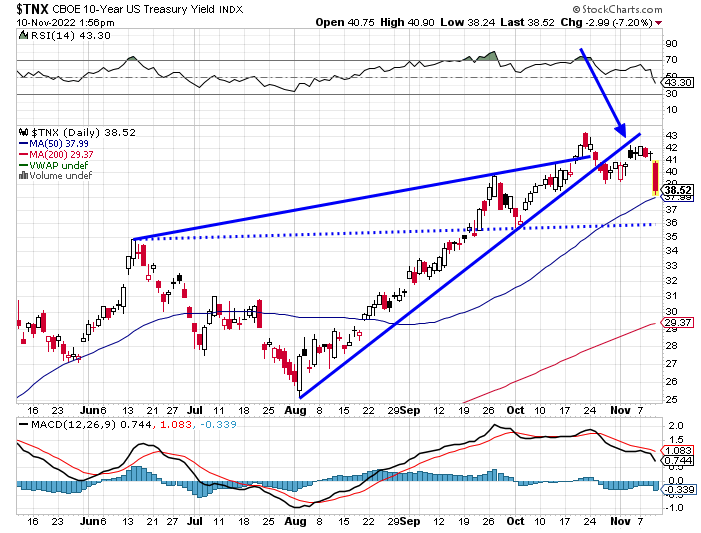
Last week, the 10-year yield overshot the upper trend line that has been in place since mid-year. The chart below has the look of a classic Wolfe Wave pattern. The yield sits right on the lower trend line, and the target for a break would be the dashed line, which is around 3.57% or so.

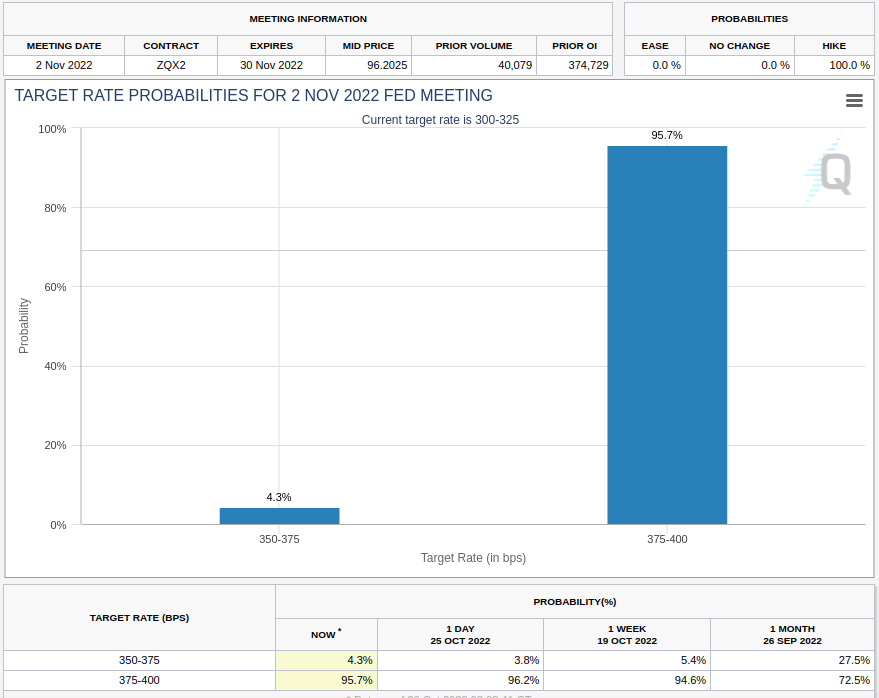
The point of all this is to say that, in the past, the Fed has stopped its hiking cycles when the effective Fed funds rate exceeds the 10-year Treasury yield. And if they do indeed raise to 3.75 to 4 next week and the 10-year yield falls to the mid 3s, then that will happen.

We'll have to wait and see how it plays out.


Hiking Cycle

In an effort to stave off inflation the Federal Reserve began its current hiking cycle earlier this year. The rate of increase has been remarkable.
The main way the Fed affects economic activity is through mortgage rates, which move in lockstep with the 10-year Treasury, but the 10-year is only indirectly influenced by Fed policy.
In anticipation of the Fed's actions, the bond market has sent the 10-year yield soaring (in relative terms) over the last few months, and mortgage rates have followed along.


How high will they go?


This chart plots the effective Federal Funds rate (red) and the 10-year Treasury yield (blue). One thing that jumps out is how the Federal Funds rate tends to rise during hiking cycles until it crosses above the 10-year yield.
Almost immediately it stops rising and a short time later it begins to fall. Will this happen again? Who knows?


Become a Contributor

This article was written by: Anonymous
  • The author does not have a financial interest (stocks, options, other) in any companies mentioned in this article.
  • The author has indicated that this article is an original work. It expresses their opinions.
  • The author does not have a business relationship with companies mentioned in this article.

  • Facebook Linked In Reddit StockTwits Tweet Email this to someone


    Tickers of Interest

    ISBAIWBKYMRFNWBLIFE
    NIECZFSDSUFANGDNUT

    Nothing on this site is meant to be a recommendation to buy or sell securities nor an offer to buy or sell securities. Use this information at your own risk.
    Your continued use of this site implies agreement with our terms and conditions, which may be revised from time to time.