|
|
Daily Trading Signals We originally created this site in order to help level the playing field for the average investor. Access to the available borrow and fee rates for every US-listed stock is and will be free for everyone forever. Recently though we decided that we wanted to share something even more important: investing philosophy. People talk about things like the importance of diversification and how risky margin trading can be. These concepts are very often just nebulous and intangible. What we want to try to do is to quantify them with math and statistics. Every day on social media people share their stock portfolios. It is alarming the number of people who hold fewer than 5 stocks. Here's a nice thought exercise for you:
A 50% drop in any one stock is devastating and is also fairly common. By simply avoiding the use of margin and by holding a sufficient number of stocks you can dramatically reduce drawdown. This article discusses this extremely important subject. The bottom line is that the optimal number of stocks to hold is 20 to 30. Look again at this table:
We don't actually recommend the use of margin for one simple reason. If you use margin, you need to be prepared for a margin call at any time for the entire amount borrowed. At 2x leverage on a $10,000 portfolio you would need to keep a cash reserve of $10,000. If you have the cash why not just put it all in the stock market, avoid paying margin interest, and consequently never have to worry about getting a margin call or being forced to sell your stock at fire sale prices! If you take away nothing else from this portion of our site, learn this important fact. Diversification is crucial. Now if you add to these two simple rules (diversification and no margin) a trading system that outperforms the market consistently you really have a winning strategy. Lots of people have asked us: if you have such a great trading system, why don't you trade it yourselves? We do! We have had great success with the system, and in fact have largely automated it. It is quite simple yet extremely powerful. You supply the stocks and we supply the trading signals. It is really that easy. Every Daily Trading Signals member is able to maintain a list of 50 stocks that they can change at any time. And every day after the close our system tells you to either buy or sell each stock at the open of the next trading day or continue to hold that position. You can place your orders with your broker the night before to be executed at the market when the regular trading session opens. We will never divulge the trading algorithm. That is proprietary. You can read more about the trading system below and/or watch a quick video to see how it works.
Our trading system is based on technical analysis and is the result of years of backtesting and development.
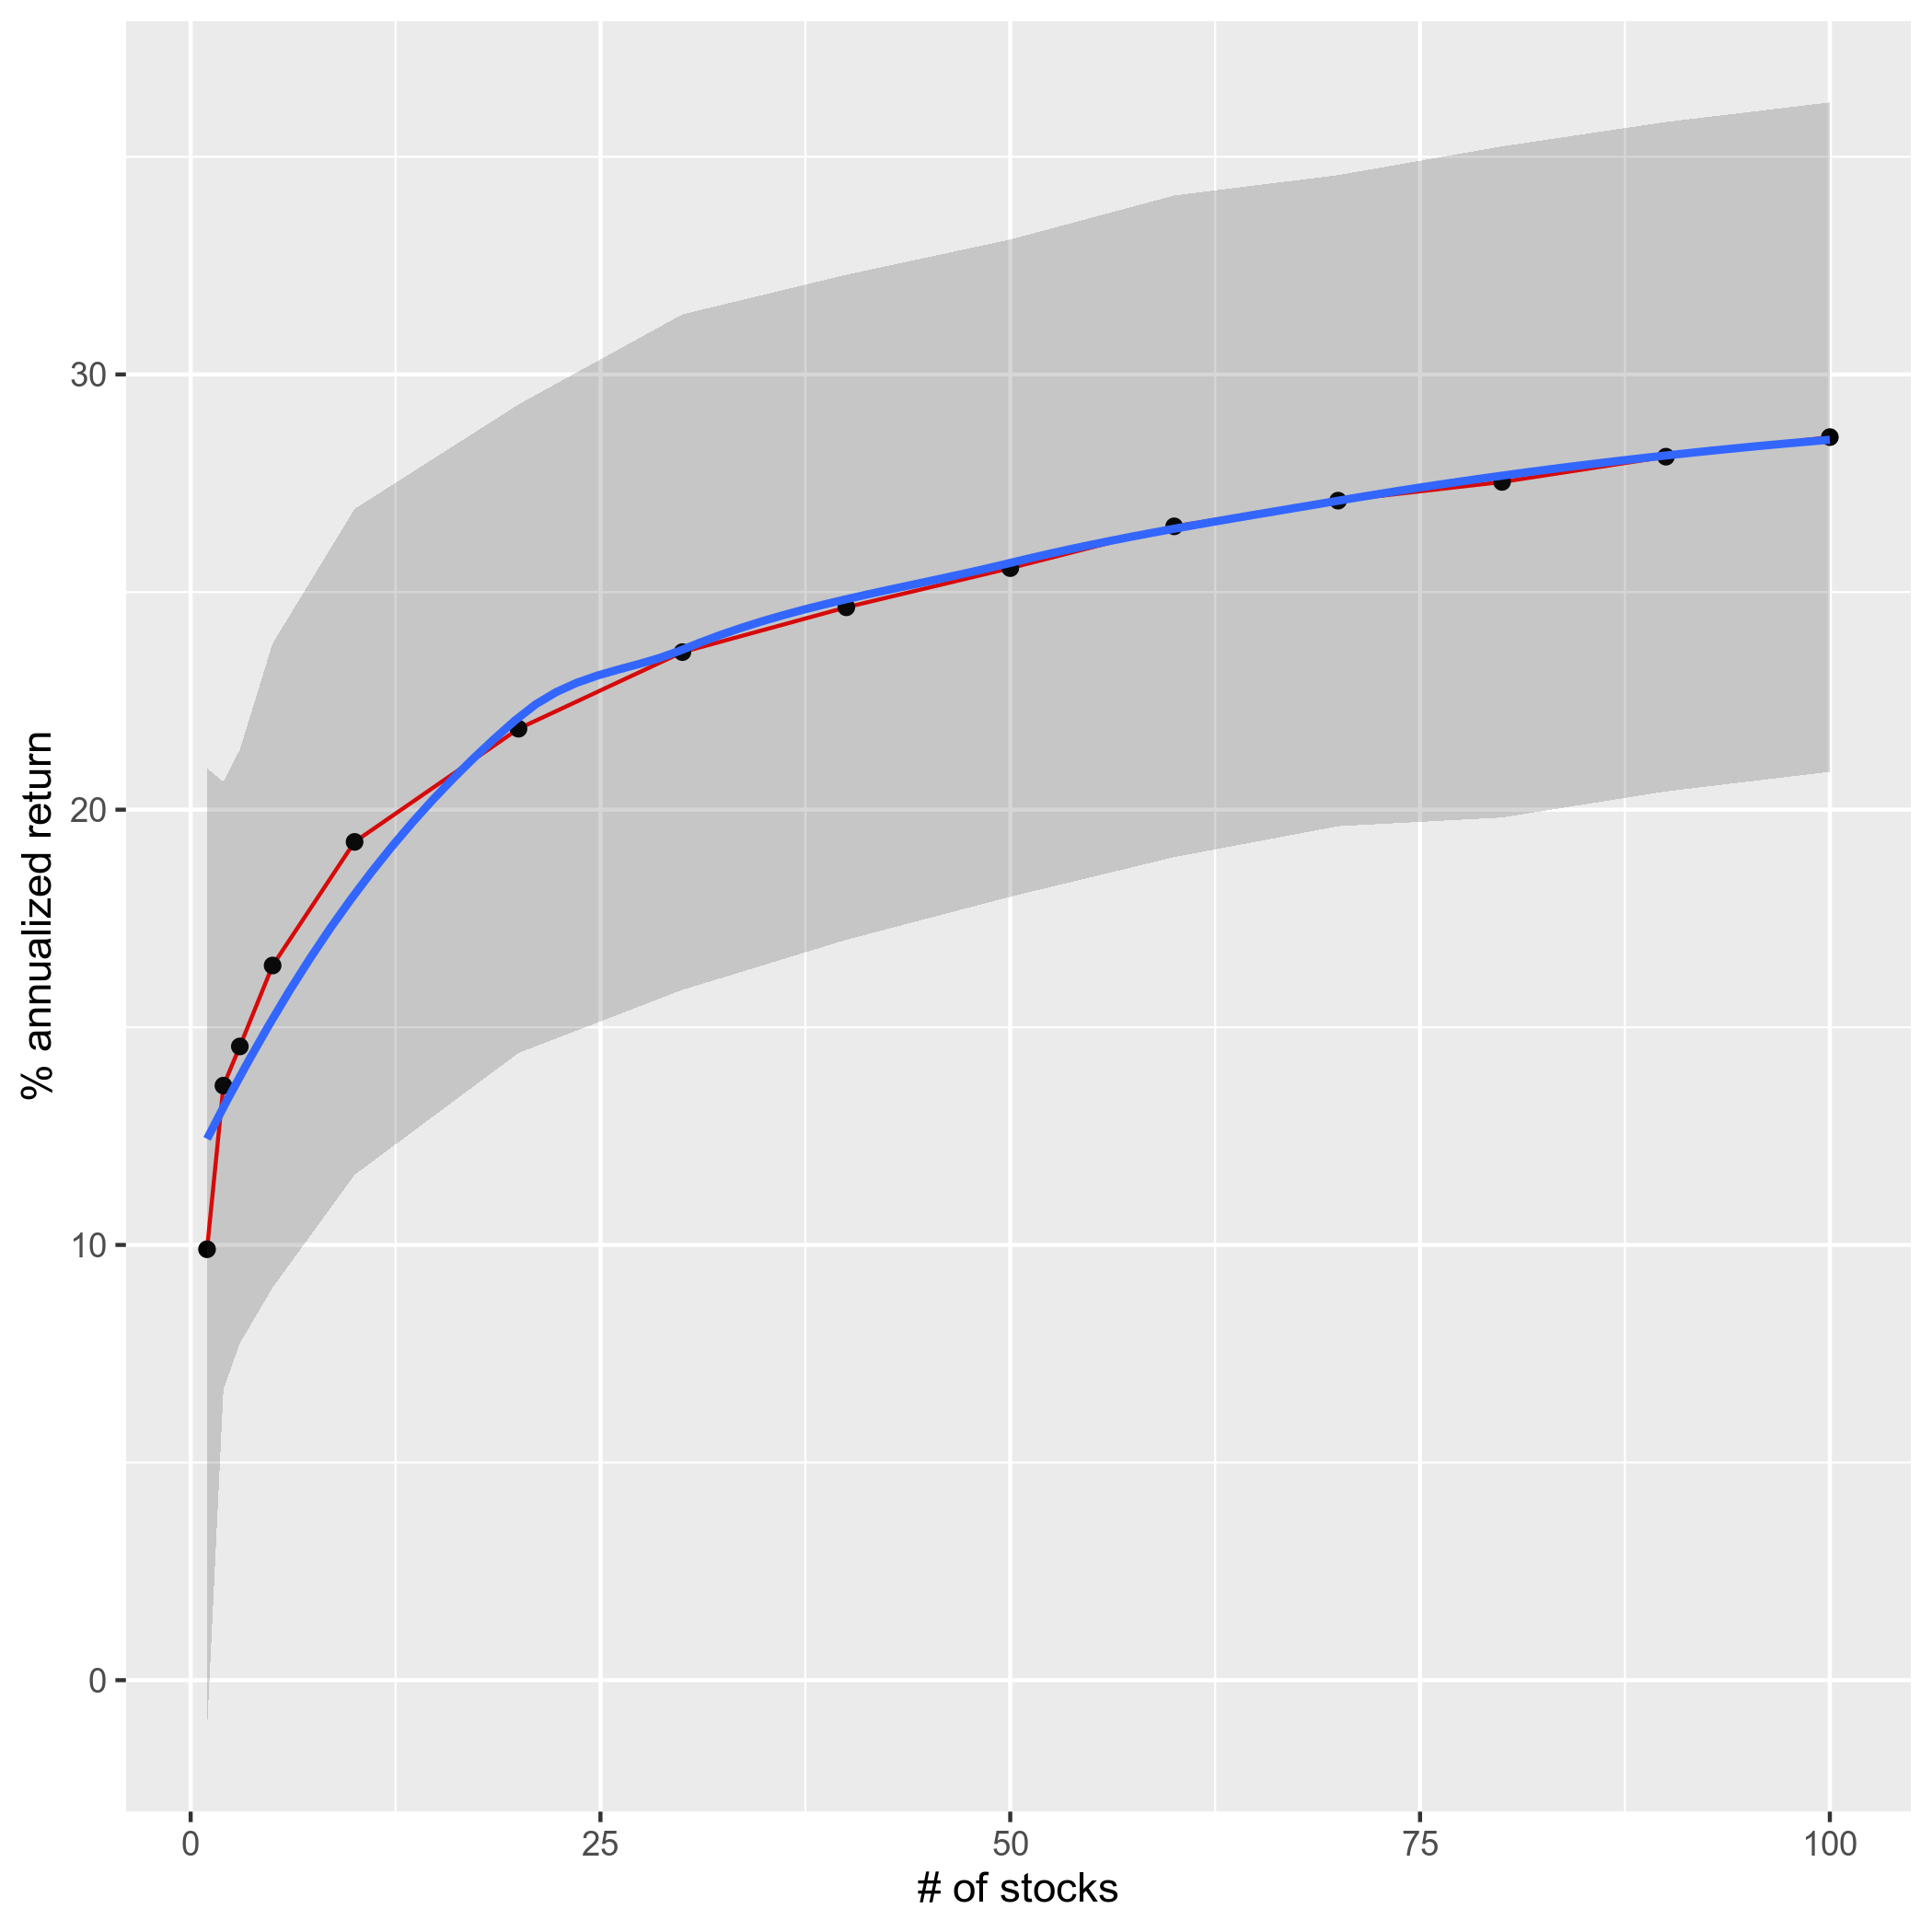
We performed a rigorous statistical analysis on our trading system. We bootstrapped 1000 instances using 1, 2, 3, 5, 10, 20, 30, 40, 50, 60, 70, 80, 90, and 100 random stocks from the S&P 500 and calculated annualized return and maximum drawdown from inception (1990-01-02). Below are the results of these tests:
The graph clearly shows that performance suffers when there are too few stocks in a portfolio. There is also clearly an upper limit to the increase in performance by adding stocks to the portfolio. The importance of all this is that there is safety in numbers. Even during the depths of the great financial crisis of 2008 a diversified portfolio using our system outperformed the market. There are no future guarantees, of course, but this exercise helps to give you an idea of what to expect in terms of performance and drawdown. Drawdown is calculated from every new all-time high. Register for a free account to learn more.
Nothing on this site is meant to be a recommendation to buy or sell securities nor an offer to buy or sell securities. Use this information at your own risk.
| ||||||||||||||||||||||||||||||||||||||||||||||||||||||||||