I noticed that Mullen was up quite a bit over the last few weeks and it's been regularly topping the trending tickers list so I decided to check it out. Keep in mind that it had traded as low as $0.18 so any rally is from a ridiculously low level. The recent move to $0.40 in mid-December is over 100% from the low, for example.
Keep in mind that the $0.18 low was an
all-time low on a chart that has basically done nothing but go straight
down since it went public. Well, maybe that's a little unfair since
there have been many HUGE rallies along the way, but the trend has been
mostly down. It's a trader's dream if you can get the timing right, but a long-term hold it is certainly not-- at least for now.
Wolfe Wave
One of my favorite chart patterns is the
Wolfe Wave. It's not that widely used and it works very well. Anyway, as I was looking at a weekly chart of
MULN I noticed a Wolfe wave pattern. It's not perfect (these things never are) so don't shoot me, but it makes for a somewhat interesting discussion.
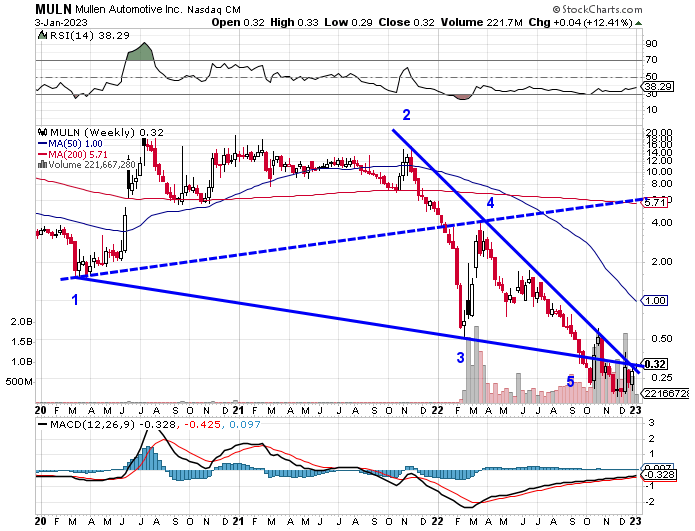
The target of this pattern is an extension of the dashed line. What's interesting is that it happens to coincide with the 200-week simple moving average. The stock is at about $0.30 as I write this so a move to $5.50 or so would be quite large. No, I don't expect it to happen in the next week, but I suppose you never know. It also may never happen at all. And the thing to keep in mind here is that the buy signal is a breakout of the trend line joining points 2 and 4. It has attempted to break out above that line twice over the last few months and failed both times so this could end up being a total bust.
Highly Speculative
Mullen has been a speculative darling for a long time, and it has essentially been pre-revenue. However, they are now starting to generate meaningful sales. They just announced a $200 million
purchase order last month. That's a pretty big deal.
The stock market has been weak for a long time now, and stocks like Mullen have been taken to the woodshed, so I definitely wouldn't hold my breath on this one at all. But a break above that downward sloping trend line could be a sign of much bigger things to come.
Oh yeah, I almost forgot to mention that the fee and rebate rates have skyrocketed recently to levels not seen in quite some time. Here's a six-month chart of the stock borrow availability and fee rate:
So yeah, there's that.