I have been using this tool from Shortable Stocks for a few weeks now, and I'm still trying to wrap my head around how best to implement it, but there have been some amazing results.
First of all, where to find it. If you're using the desktop version, you'll see the link under short sales transactions for any given stock.
On mobile it will be under the short sales transactions tab.
Big List
I understand it's a big list and it's a lot to sift through, but I think you'll find if you take the time to systematically analyze this list, you will find some great trading opportunities. I know I have.
List from 2022-10-14
The following screenshot is a partial list from just yesterday's trading. It only shows total unusual short sales transactions for the day over $5M.
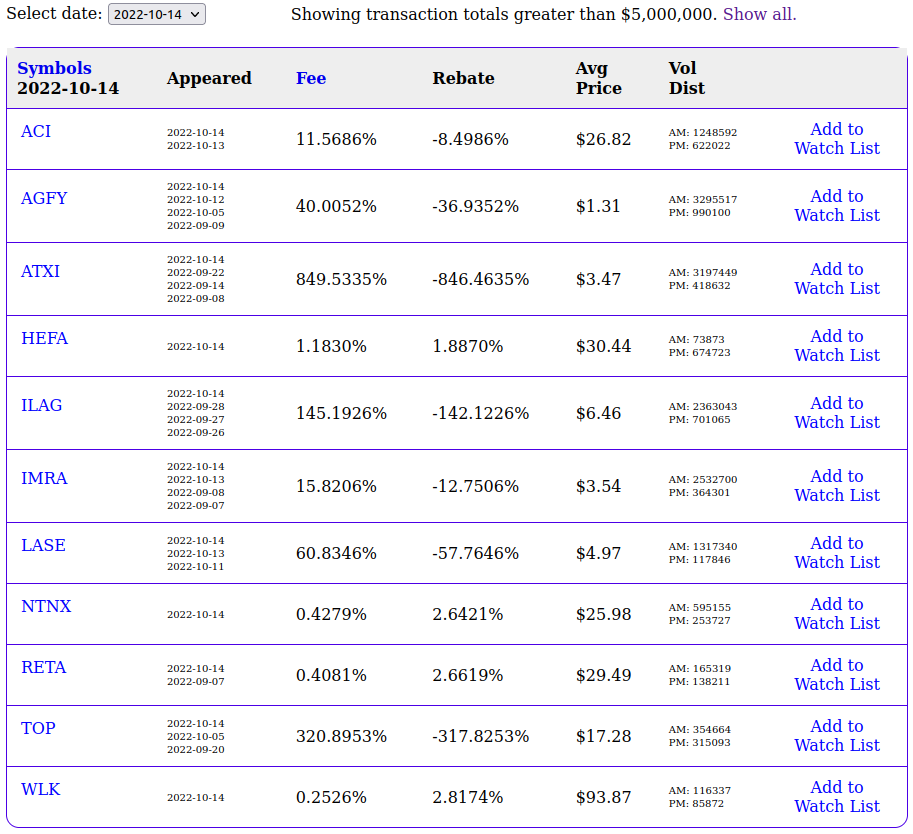
There's a lot of information here so let me unpack it a bit. First of all, you can sort the list by ticker symbol (as it is here) or by fee rate. I tend to focus on stocks with high fee rates (I usually ignore anything under 10%), and I also generally exclude ETFs. Quite a few ETFs appear on these screens.
The tool shows when else any stock has appeared on this list in the past (we show up to 5 prior appearances). The average price is just that, the average price the stock was shorted at for the given date. Furthermore, we break down the volume totals for AM and PM to show the volume distribution for the day. The day is broken exactly in half at 12:45 EST so it's not quite AM vs PM, but it's very close. There's an interesting
paper that discusses the timing of short sales and its implications for future price behavior. Here's an excerpt from the abstract:
"Using intraday 2015-2019 short sale data from CBOE and FINRA, we examine
the intraday time patterns and information content of on-exchange and
off-exchange shorting. Midday short sales and those near the open
strongly and negatively predict the cross-section of stock returns at
daily horizons and up to 12 weeks ahead. Short sales near the close are
only informative at next-day horizons."
Those findings inform the decision to include the volume distribution information.
Let's Analyze Top Fee Rates in Order
Update: 2022-10-16
Update: 2022-10-16
Information Overload
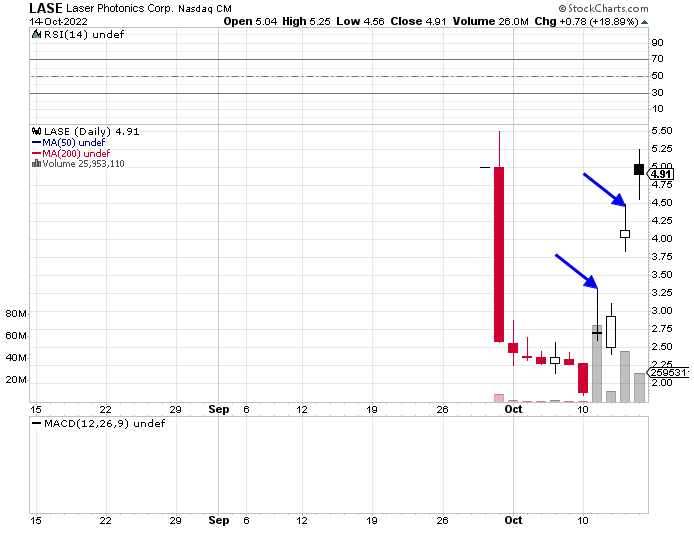
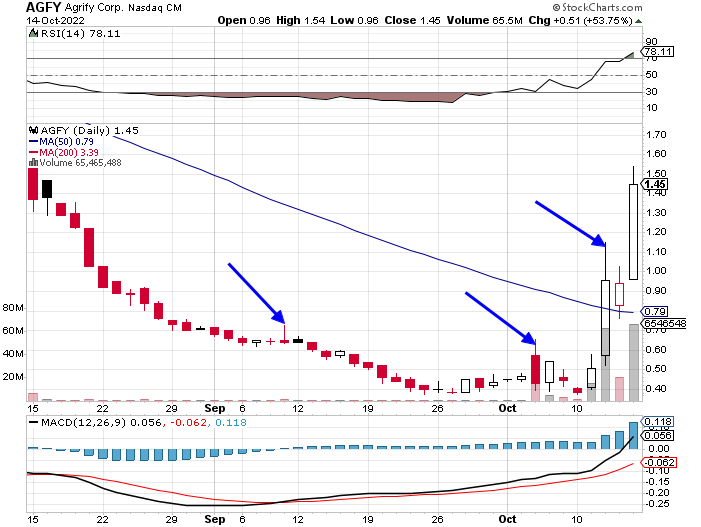
It's a lot of information. I get that. And you certainly (probably) will not have success just buying any stock indiscrimately as it appears on the list. Furthermore, I strongly recommend you use a trailing stop as your positions go up in value.
TOP is a great example in this regard.
Premium Tool
This tool is only available to our standard subscribers. As a standard subscriber you will have access to
everything on this site including the daily trading signals, which is part of our
trading system.
We are convinced that you will make more money using these premium tools. You won't find anything like our analysis anywhere else.
Update: 2022-10-16
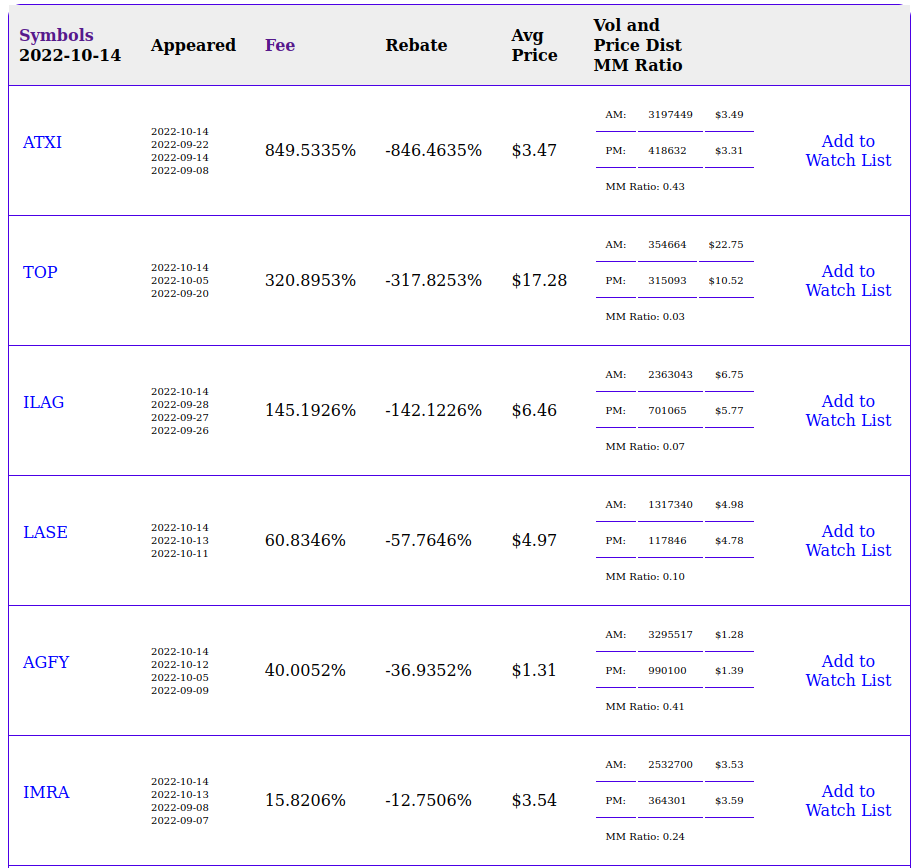
We added AM and PM price distribution as well as the market maker ratio of the total short sale activity for any given day. Compare this screenshot with the one from above.