Stock Trading System Performance for AI | Shortable Stocks


Consider trading the QQQ ETF at Trade the QQQ.


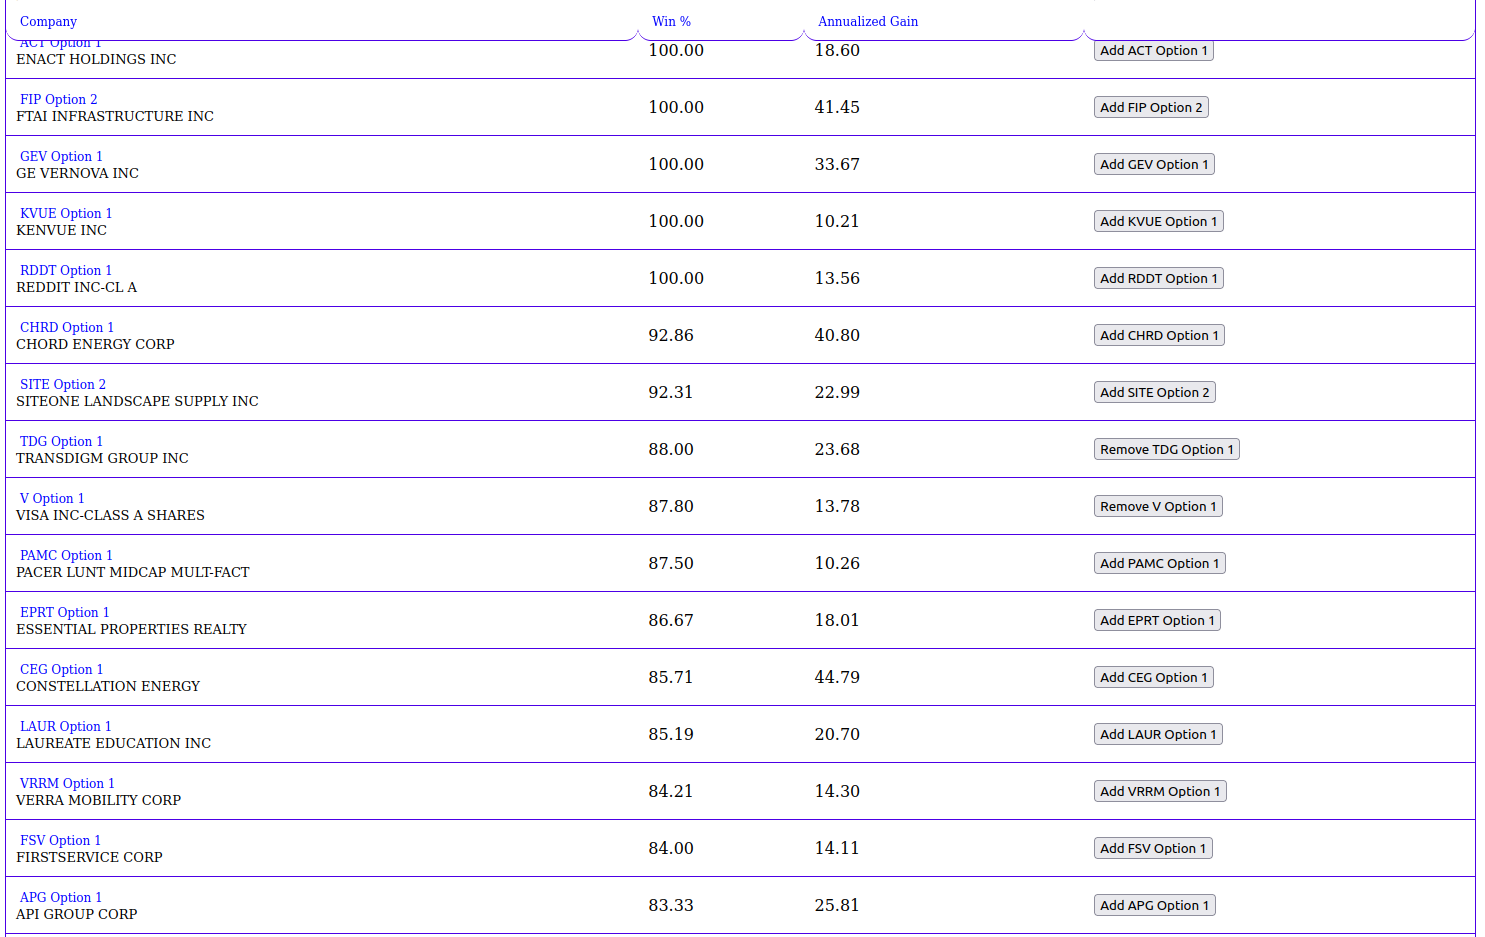
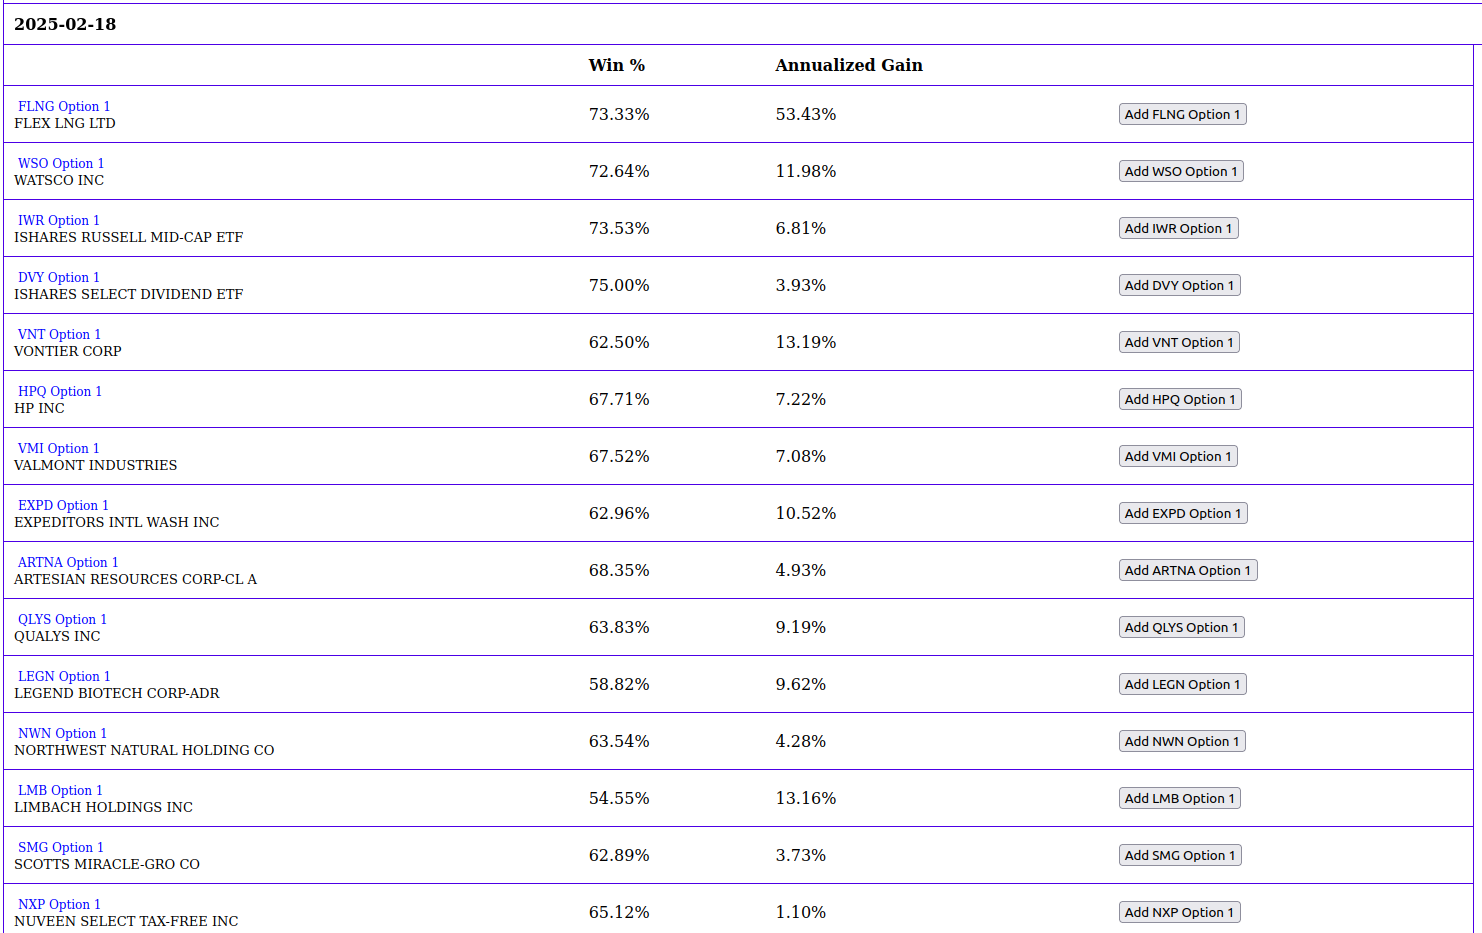
A sortable list of the best performing stocks for our trading programs is available. Use the Daily Trading Signals Tool to help you find the best stocks for this trading program.

As a rule of thumb, the trading system works best for mid- to large-cap stocks so keep that in mind as you're checking individual names.

Ticker symbol:

AI -- C3.AI INC-A

Choose one of the trading program options below for AI

Option 1

Start date:2020-12-08
Total round-trip trades:18
Winning percentage:44.44%
Arithmetic average gain:23.01%
Number of stops:9
Ending capital:$5,880.57
Annualized gain:-12.92%
 
Leverage:None
Starting capital:$10,000
Stop loss:20%

Most recent trades omitted

Option 2

Start date:2020-12-08
Total round-trip trades:16
Winning percentage:12.50%
Arithmetic average gain:53.65%
Number of stops:5
Ending capital:$6,997.54
Annualized gain:-8.88%
 
Leverage:None
Starting Capital:$10,000
Stop Loss:15%


Most recent trades omitted


Rules
Trading Frequency:The system does not trade frequently. Most trades have from one to a few months holding period. There are usually no more than two to four round-trip trades per ticker per year.
Actual Trading:With the exception of stop losses the system generates buy and sell signals to be executed at the open the following trading day. Generally the signals will be available by 6:00pm EST after the market closes each trading day.
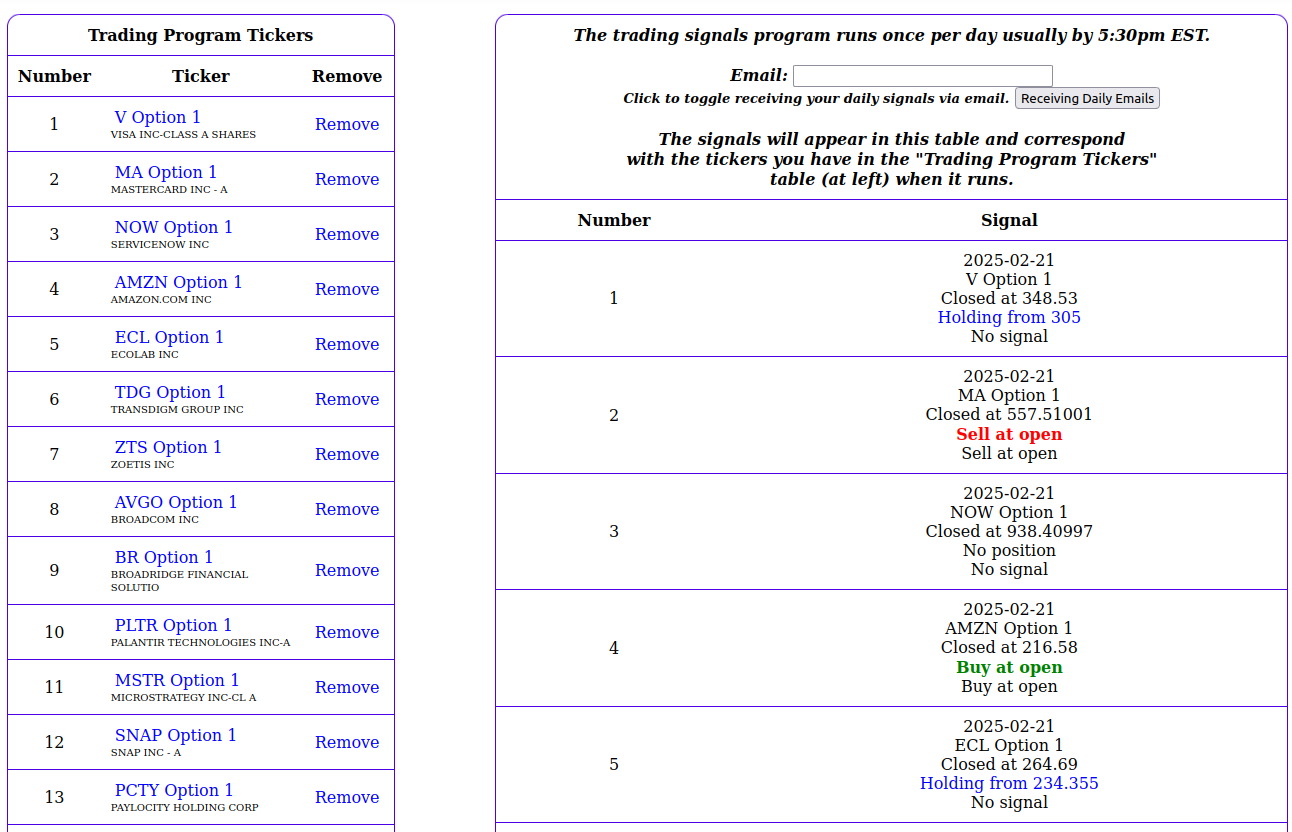
Signals:You may add and remove ticker symbols from your list as often as you wish. Whichever tickers are in each slot will get signals when they are generated. Those signals will be available until the next signal update.


Daily Trading Signals

We originally created this site in order to help level the playing field for the average investor. Access to the available borrow and fee rates for every US-listed stock is and will be free for everyone forever. Recently though we decided that we wanted to share something even more important: investing philosophy. People talk about things like the importance of diversification and how risky margin trading can be. These concepts are very often just nebulous and intangible. What we want to try to do is to quantify them with math and statistics.

Every day on social media people share their stock portfolios. It is alarming the number of people who hold fewer than 5 stocks. Here's a nice thought exercise for you:

# of stocks135
Effect on portfolio of
50% drop in one stock
50%16.67%10%
With 2x leverage100%33.33%20%

A 50% drop in any one stock is devastating and is also fairly common. By simply avoiding the use of margin and by holding a sufficient number of stocks you can dramatically reduce drawdown. This article discusses this extremely important subject. The bottom line is that the optimal number of stocks to hold is 20 to 30. Look again at this table:

# of stocks203040
Effect on portfolio of
50% drop in one stock
2.5%1.67%1.25%
With 2x leverage5%3.33%2.5%

We don't actually recommend the use of margin for one simple reason. If you use margin, you need to be prepared for a margin call at any time for the entire amount borrowed. At 2x leverage on a $10,000 portfolio you would need to keep a cash reserve of $10,000. If you have the cash why not just put it all in the stock market, avoid paying margin interest, and consequently never have to worry about getting a margin call or being forced to sell your stock at fire sale prices!

If you take away nothing else from this portion of our site, learn this important fact. Diversification is crucial.

Now if you add to these two simple rules (diversification and no margin) a trading system that outperforms the market consistently you really have a winning strategy. Lots of people have asked us: if you have such a great trading system, why don't you trade it yourselves? We do! We have had great success with the system, and in fact have largely automated it. It is quite simple yet extremely powerful.

You supply the stocks and we supply the trading signals.

It is really that easy. Every Daily Trading Signals member is able to maintain a list of 50 stocks that they can change at any time. And every day after the close our system tells you to either buy or sell each stock at the open of the next trading day or continue to hold that position. You can place your orders with your broker the night before to be executed at the market when the regular trading session opens.

We will never divulge the trading algorithm. That is proprietary. You can read more about the trading system below and/or watch a quick video to see how it works.


"I like your site because it seems that it approximates what hedge funds do with their algos. It offers some objective information in a sea of nonsense." Mary from Tucson, AZ

"Thank you for this site! It has helped me a ton. Just getting going on your trading system and already making money. Looking forward to the future!" Bill C. from Myrtle Beach, SC

"I've tried for years to put together a winning strategy to make money in the stock market. Your site does it all for me. When to buy and when to sell. Membership fee pays for itself. Thanks!" JR from Orlando, FL

"I wish I knew about shortable stocks before. I would of been making better trading decisions for longer. Thank you so much!" Randall P. from Los Angeles, CA

Our trading system is based on technical analysis and is the result of years of backtesting and development.
Below are the lifetime results for a large number of S&P 500 and Russell 2000 stocks. The gains are extraordinary. In each case the beginning capital was $10,000. All profits (and losses) are considered to be reinvested, and taxes and commissions are not factored in. When we talk about annualized gains on this site what we mean is that the gains are expressed in yearly terms. A stock that was backtested since 2014, for example, with an annualized gain of 34.67% means that it earned that gain every single year on average.

Furthermore, we tested an equal weighting of $10,000 invested in a random sample of S&P 500 stocks as it's presently constituted. The statistical analysis is provided below. There were losses, of course, but the winners exceeded the losers by far. You are encouraged to investigate performance for any and all stock tickers. Most large and mid cap stocks have been backtested.

We performed a rigorous statistical analysis on our trading system. We bootstrapped 1000 instances using 1, 2, 3, 5, 10, 20, 30, 40, 50, 60, 70, 80, 90, and 100 random stocks from the S&P 500 and calculated annualized return and maximum drawdown from inception (1990-01-02). Below are the results of these tests:

S&P 500 Results
20 random S&P 500 stocks bootstrapped 1000 times
Leverage:None
Average maximum drawdown for entire portfolio:29.31%
Standard deviation:6.61
95% Confidence Interval:16.35, 42.27


30 random S&P 500 stocks bootstrapped 1000 times
Leverage:None
Average maximum drawdown for entire portfolio:27.13%
Standard deviation:5.02
95% Confidence Interval:17.28, 36.98


40 random S&P 500 stocks bootstrapped 1000 times
Leverage:None
Average maximum drawdown for entire portfolio:26.14%
Standard deviation:4.19
95% Confidence Interval:17.93, 34.35


The graph clearly shows that performance suffers when there are too few stocks in a portfolio. There is also clearly an upper limit to the increase in performance by adding stocks to the portfolio. The importance of all this is that there is safety in numbers. Even during the depths of the great financial crisis of 2008 a diversified portfolio using our system outperformed the market. There are no future guarantees, of course, but this exercise helps to give you an idea of what to expect in terms of performance and drawdown. Drawdown is calculated from every new all-time high.


Click to toggle

We have recently developed a new model that we think is pretty exciting. This model trades the QQQ and TQQQ ETFs and/or the E-mini NASDAQ-100 futures. Click "Liquidity Model" above to read about this model in detail.


Register for a free account to learn more.

Updated: 2024-10-15
Notes:
There are a vast array of stock trading systems for investors to choose from. Whether it's a trading system designed to trade in and out multiple times per day or a longer-dated trading system that trades in yearly time frames, a trading system's purpose is to extract money from the markets.

A stock trading system is any program that uses a set of rules to make trading decisions for you. The idea is that you can develop a set of rules that look like they work to make money and then you can backtest those rules to see how they performed over time. Essentially there are two types of stock trading systems: rigid and flexible. Some people prefer having a rules-based stock trading system where in the moment the trading program makes all the decisions. Others like a more flexible stock trading system that allows a more nuanced approach to the trading decisions.

You may not need a stock trading system. They're not for everyone. A lot of people have difficulty making tough decisions (such as taking a stop loss), and therefore can benefit from a stock trading system that works without emotion. On the other hand it is sometimes difficult to make a decision to buy. After all, the best time to buy is very often when sentiment is at an extreme low, and by definition people generally don't feel very good at those times.

A self-designed and self-directed stock trading system is designed by the individual investor him- or herself. You subscribe to a service that allows you to create trading strategies based on fundamental and technical analysis. Oftentimes, these require the use of proprietary programming languages. This type of stock trading system is extremely difficult for the average investor. Not only must you develop a stock trading system that makes money over time, you must also backtest it to be sure that it works in every time frame. The benefit of this type of stock trading system is that the user has full control.

A quick example of a rigid and rules-based stock trading system is in the chart below. A buy signal is generated when the 50-day simple moving average (SMA), the blue line, crosses above the 200-day SMA, the red line, and a sell signal is generated when the blue line crosses below the red line. At first glance, it may seem that something like this would work well. The reality is that there is too much of a lag in the signals. When people talk about the golden cross and the death cross, they are talking about this.

Flexible Stock Trading Systems These types of stock trading systems are based on patterns. You will hear lots of colorful names thrown about when people talk about stocks. Cup-with-handle, high tight flag, rising wedge, falling wedge, you name it. There are hundreds of them! It takes a lot of study to learn these various patterns. Then, it takes a lot of practice to see how well they work in the real world. This type of stock trading system is much more difficult to backtest, because they are so flexible. Computer programs make decisions on a fixed rule set, and this type of stock trading system is the antithesis of that by design.

Here's a quick example of a common pattern that you will hear when discussing a flexible stock trading system. This is William O'Neil's famous cup-with-handle pattern applied to the stock Baidu (BIDU).

There are rules involved in recognizing this type of pattern, of course, but they are very subjective. They say things like:

There must be at least a 30% uptrend, but it has to be before the base starts. The total time of the cup with handle must be at least seven weeks, but it can only be six weeks if there's no handle. The handle has to be at least five days long, but it can be weeks and weeks long. There are "rules" based on the depth of the cup and the depth of the handle.

These things are all subjective and can lead a trader to indecision. This trading pattern has been very successful, however, and continues to demonstrate great performance for those people willing to put in the time and effort to learning it and applying it to thousands of stocks to find a potential winner.

Another type of trading pattern for a flexible stock trading system is a declining or falling wedge. The idea with this pattern is that you need to recognize certain things happening on the chart and then decide when the time is right to make a trade. There's a requirement that there be a prior trend, that there must be two converging trend lines (as shown in the image below), and then a breakout accompanied by large volume. This is another great pattern that people have successfully used as part of a flexible stock trading system, but keep in mind that is also pretty subjective. How much volume is enough volume? What about the converging trend lines? What if they aren't picture perfect like the example below?

Black Box Stock Trading Systems This leads us to the final type of stock trading system-- the black box stock trading system. You can see the input for the stock trading system (your stock symbol), and you can see the output of the stock trading system (when to buy and sell), but you don't see any of the rules that the stock trading system employs. This is by far the most popular type of stock trading system out there. People have a lot of incentive to create a stock trading system that works. The problem is that it is extremely difficult to do. And because they are black boxes and come with the usual performance disclaimers there's no way of knowing whether a stock trading system is any good.

Or is there a way to know if a stock trading system is any good?

The key to instilling confidence in any black box stock trading system is transparency. Not about exactly how the stock trading system works, but how it performs over time. Any stock trading system worthy of consideration must tell you how it's done in the past so you have an idea how it will do in the future. Simple, right? The problem is that many stock trading systems will purposely obfuscate their performance statistics because, well, they're probably not very good. Let's face it: If every stock trading system out there was good, there would be a lot more billionaires in the world. So, how well has it done in the past? Preferably the black box stock trading system should show exactly when trades were executed including losses and stop losses. There is a fine line between transparency for instilling confidence and transparency that gives too much information about the secret inner workings of the stock trading system so be aware that there's a limit here.

Simulated Performance

It is also a really good idea to put the system through a randomized performance simulator, a process that is common in statistics called bootstrapping. This is a relatively simple but extremely powerful technique for increasing the stability of any statistical result. Nothing is guaranteed, of course, but bootstrapping generates asymptotically consistent results. The down side of this powerful technique is that is not widely known, it's difficult to implement, it's extremely resource heavy while doing the tests, and there's really not much available software that does this type of analysis. Generally speaking, if you're going to do any bootstrapping of your stock trading system, you're on your own. But it is extremely important to do!

Shortable Stocks Trading System

So our trading system is a black box. You won't learn how it works, because it's proprietary and valuable. It's the result of literally decades of market study. But it also benefits because of the unique abilities of our team. We are programmers at heart and have been for even longer than we've been trading, and we've been trading for a LONG time. We are also statisticians. The stock trading system we have developed is robust and extremely well tested. It has been demonstrated to work well in every environment we've seen in the past thirty years or so. We pride ourselves on providing transparency. You will be able to see every trade the stock trading system has made for any stock you want that we cover. The only thing that is limited in this regard is that we don't show trades executed within the last three months, because we feel that that could give away too much of the inner workings of the stock trading system.

Easy To Use

Our stock trading system is extremely easy to use. In fact, it was designed in such a way that you can use it even if you don't have time to watch the market all day. Like if you have a 9 to 5 job. We really have gone out of our way to make this stock trading system accessible to everyone. The general idea is that you can build a list of 50 stocks that the stock trading system watches for you on a daily basis. We even help you build that list based on the performance metrics of the past. Nothing is guaranteed, of course, but past performance is the best indication for the future. The stock trading system will then tell you what to do with every stock after the close of every market day. The trades to be executed will always happen at the open of the next market day meaning that you can manage your portfolio in just a few minutes every evening. Standing stop loss orders must be entered along with any purchase as the stock trading system instructs you to do. The stock trading system uses no margin and encourages diversification so risk management is built-in by design.

There's a reason why we have so many satisfied customers. It's because this stock trading system is helping them to consistently make money.

Nothing on this site is meant to be a recommendation to buy or sell securities nor an offer to buy or sell securities. Use this information at your own risk.
Your continued use of this site implies agreement with our terms and conditions, which may be revised from time to time.