 |
|
Trading System
Our trading system works. It is ridiculously easy to set up and maintain, and chances are that by the time your initial trial period is over it will have paid for itself.
First things first: We recommend a portfolio of 20 to 30 stocks, although we allow you to have a list of up to 50. You can read about the reasoning for this recommendation as well as our trading system methodology here. Keep in mind that this is a swing trading system that has holding periods of weeks to months.
The hard part, of course, is choosing which stocks to put on your list. This is up to you, but we have made this very easy to do. There are a few ways to add stocks to your list.
The first is by using our Daily Trading Signals - Top Performers tool. Here's a screenshot:
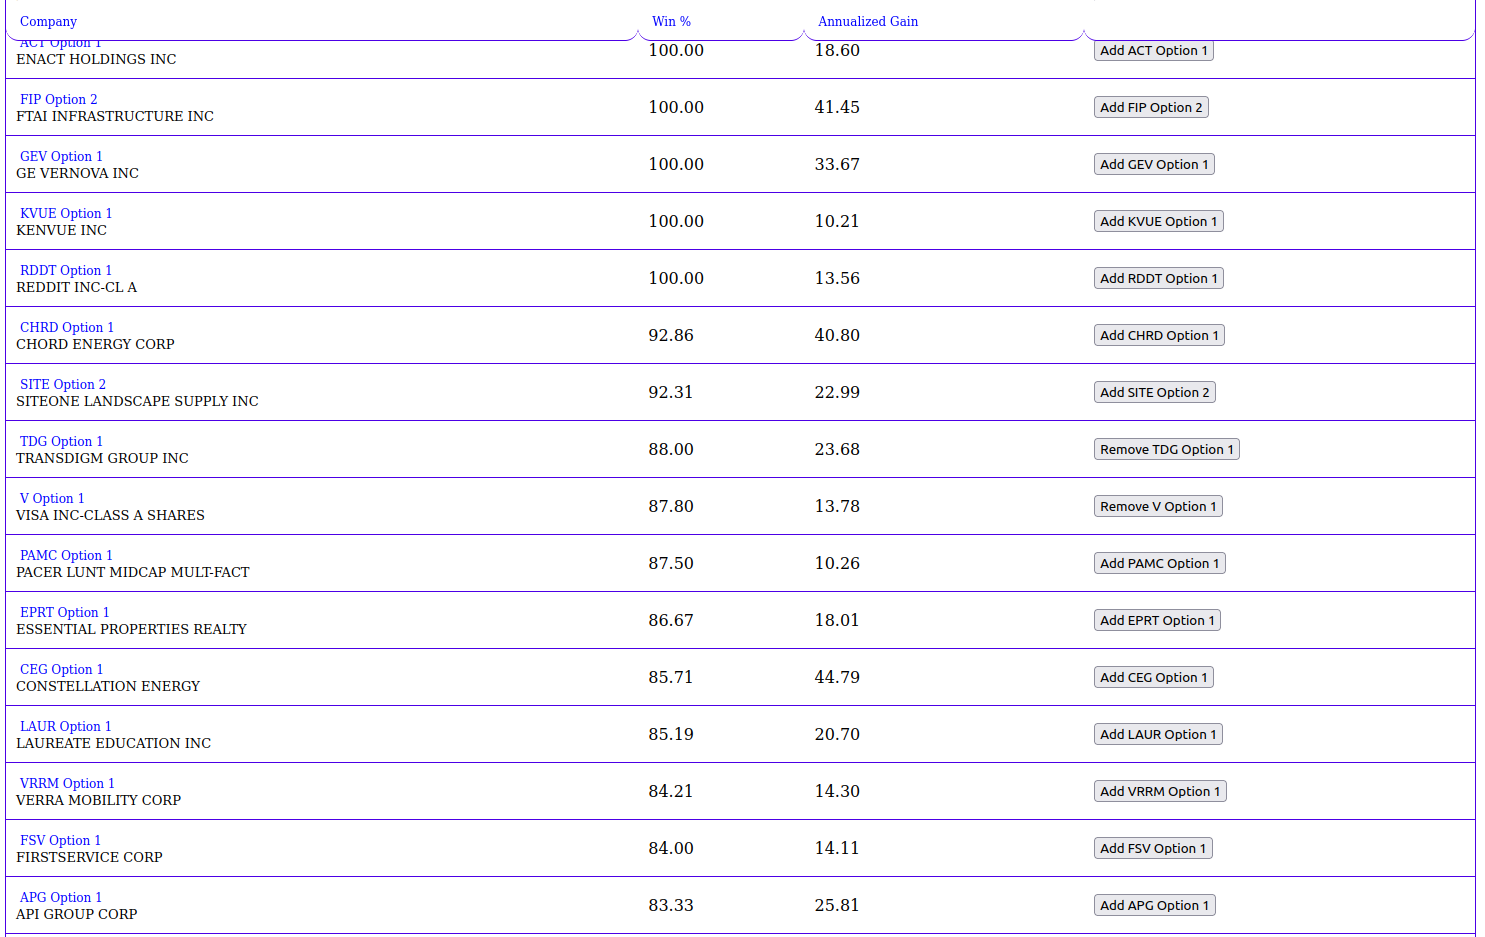
These are some of the top performing stocks that we cover sorted by winning percentage. Many of them have yet to produce a losing trade.
The second way of getting stocks on your list is by choosing from our daily list of buy signals. Our system scans the stocks we cover every day after the close to generate this list. You will be able to see actual buy signals generated over the previous week. There are usually a minimum of 5 and sometimes hundreds of stocks on these daily reports. Here's a screenshot of this tool:
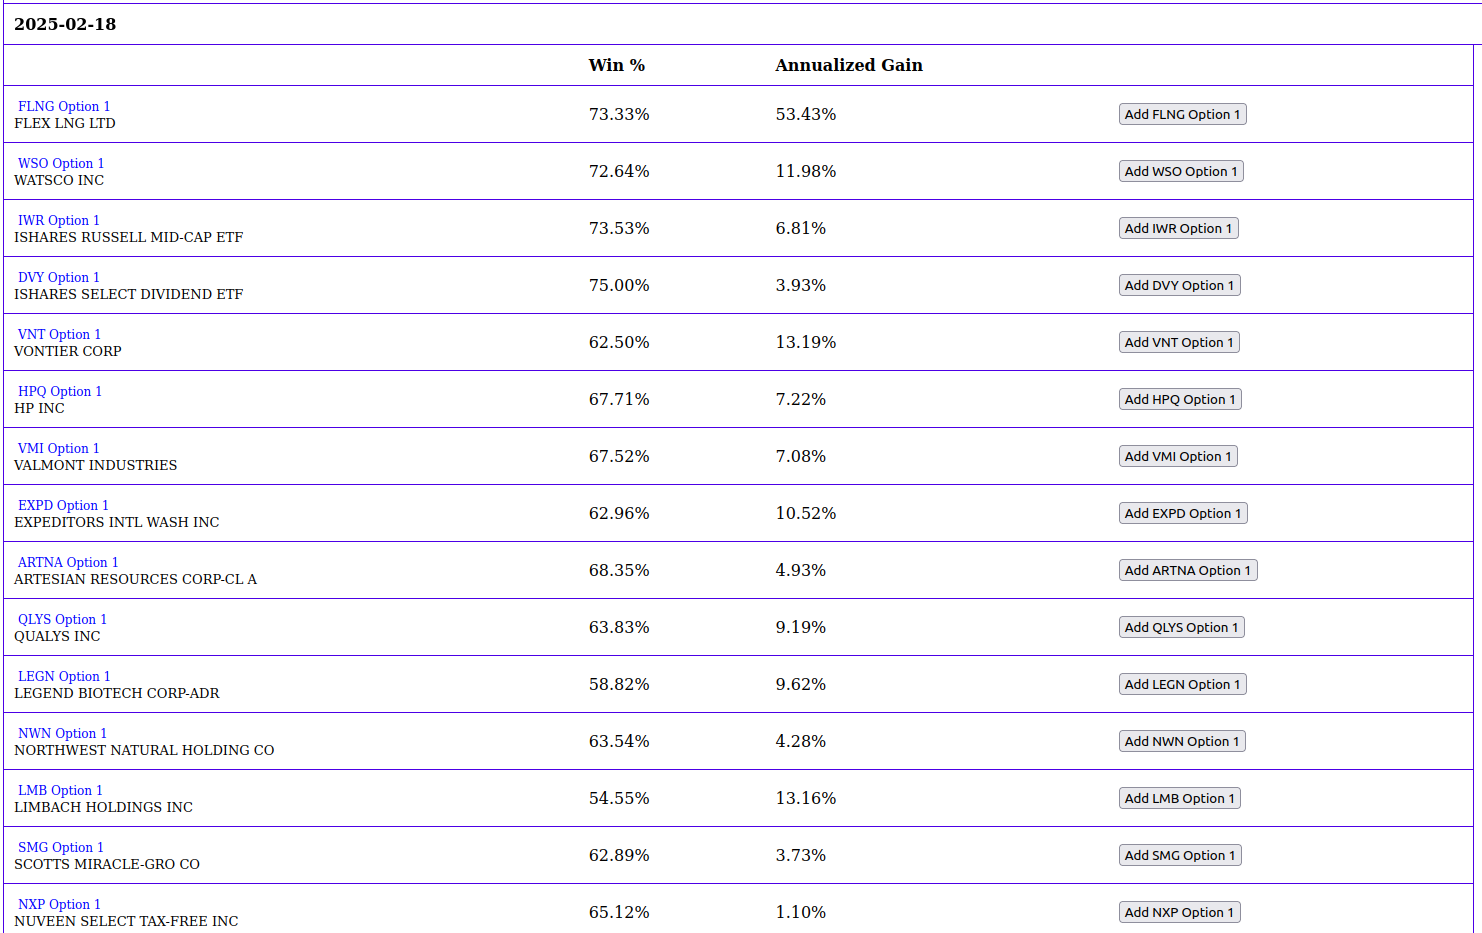
Because these are buy signals from the last week, the stocks on this list are immediately actionable allowing you to get started right away.
The third way to get stocks on your list is to research them one at a time on our site. This is certainly a more tedious method, but it has the most flexibility.
Once you get the list done you'll see it in the trading system section of the site. Here's a screenshot from that section:
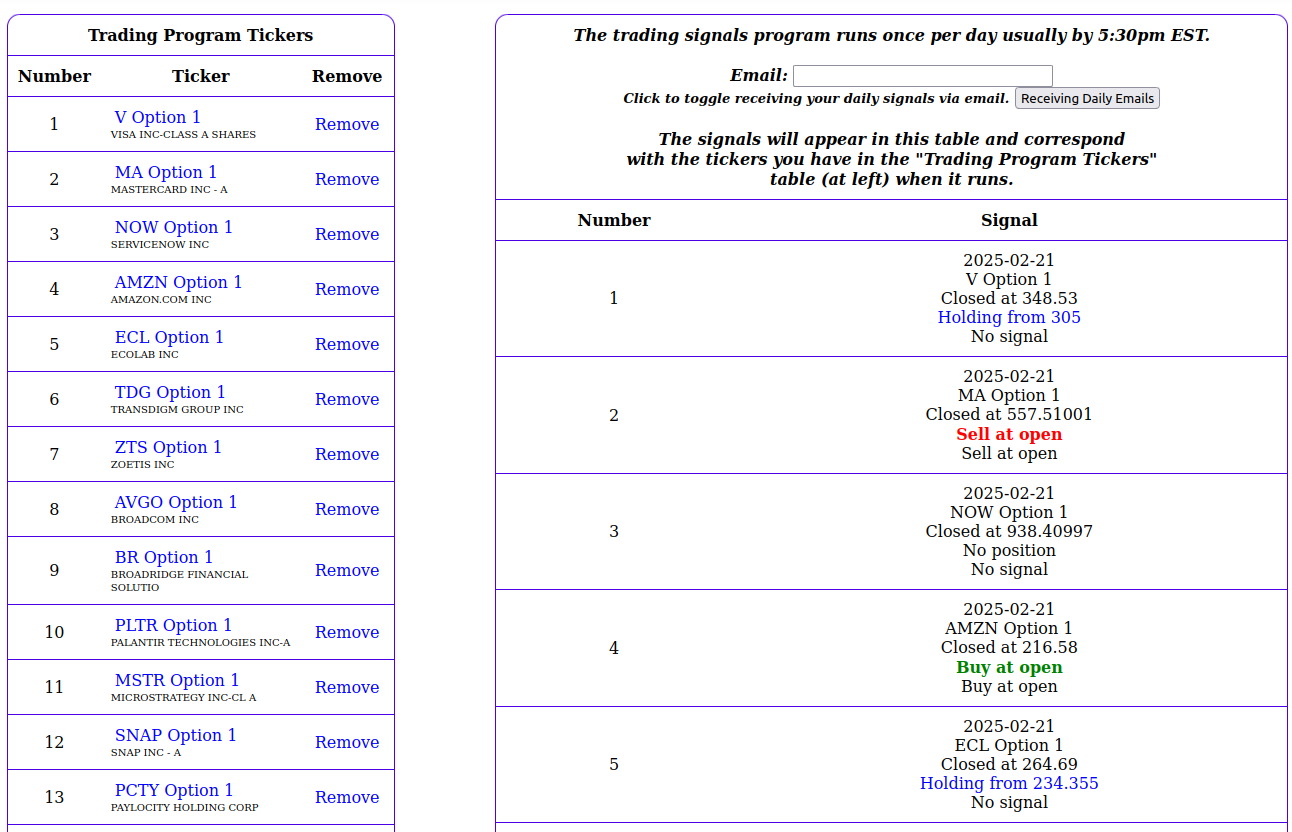
The list is on the left. The signals are on the right. Simple. When the program updates all you have to do is place orders with your broker to be executed at the next market open. Super easy.
Please register for a free account to continue.