New Tool
We have introduced a new tool based on short sale transactions that is very simple but powerful. This tool is only available to paid subscribers.
How Does It Work?
We gather short sale transaction data every market day. It's a lot of data. In fact, you won't find the level of granularity anywhere else. Other sites aggregate these data (probably because it takes some serious optimization to make them useful).
Anyway, since we gather these data for every stock we cover every single day we have an advantage that we can share with you. This new tool finds stocks that have an unusual amount of short sale transaction activity compared to its recent past. The list is updated daily.
Examples
The following are examples from the most recent list.
How Do You Use It?
There are many reasons why a stock could be heavily shorted on any given day. It could be that they reported earnings and there was heavy volume anyway. This type of activity would more than likely manifest itself as an increase in shorting by market makers, and would show up in the detailed short sale transaction data for that date. A quick look there would explain that type of short sale activity.
This image shows a few of these detailed short sale transactions for the first stock on the list above,
PEPG.
The important takeaway is the total line in bold at the end. You can see that market maker activity represented a small fraction of the total short sale transactions for the day. The vast majority was from bona fide shorting.
Again, this could still be something else, but the point is that this information is a clue as to the future possible trading in the stock.
One stock that exhibited exactly this type of behavior before it took off (and it really took off) was AMTD Digital (
HKD).
Shortly after it IPOed it had gone up a fair amount and apparently someone thought it had gone too far too fast. Boy, were they in for a surprise!
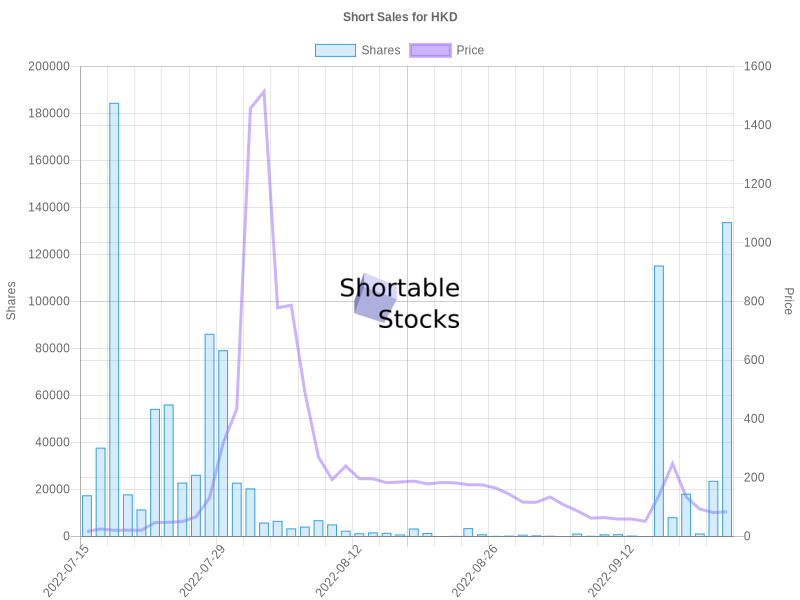
On July 19th the short sales surged. And it really looked like the shorts were in control. The chart printed a hanging man candle, which is a bearish candle. The stock settled down for a couple of days, but then BOOM! It went from around $25 to over $2500 in about two weeks.
Yes, someone got killed.
No Guarantees
There are never any guarantees about the future, of course, but these kinds of tools can give you an edge.